Chart of the Week: Creating A Trend Line Using WPF Charts to Visualize Rapid Heating in North American Oceans Nanthini Mahalingam February 20, 2024
Chart of the Week: Creating a WPF Doughnut Chart for the Top Rice-Exporting Countries Saiyath Ali Fathima M September 7, 2023
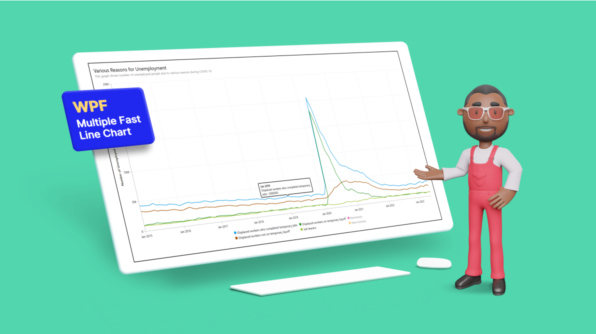
Chart of the Week: Creating a WPF Multiple Fast Line Chart to Display COVID-19’s Impact on U.S. Unemployment Moneeshram Dhanabal February 20, 2024
Chart of the Week: Creating a WPF Range Column Chart to Visualize ChatGPT’s Performance in Competitive Exams Moneeshram Dhanabal July 6, 2023
Chart of the Week: Visualize the Transfer Spending and Earning among the Football League Clubs Using WPF Scatter Chart Nanthini Mahalingam June 1, 2023
Syncfusion Mobile and Desktop Controls are Now Compatible with .NET 7 Selva Ganapathy Kathiresan November 11, 2022
Developing an Analog Clock UI in WinUI and 2022 Vol. 2 Updates in WinUI and WPF [Webinar Show Notes] Carter Harris September 2, 2022