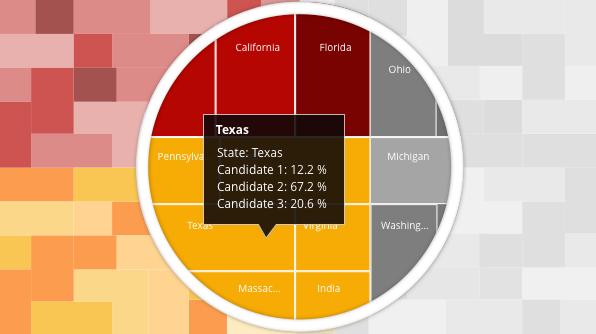
The tree map control for Essential JS 2 is used to visualize flat or hierarchical data as clustered rectangles with a specific, weighted attribute determining the size of each rectangle. It includes functionalities such as data binding, legends, data labels, tooltips, color mapping, layout types, drill-down, and more.
This blog post explores how to visualize election results using the Syncfusion tree map control in Essential JS 2. We are going to render a real-time tree map representing the state-by-state breakdown of the presidential election of the United States for the year 2016 with two different colors to represent the candidates, a title, a legend, and tooltips. The following screenshot depicts the tree map we will build in this blog.
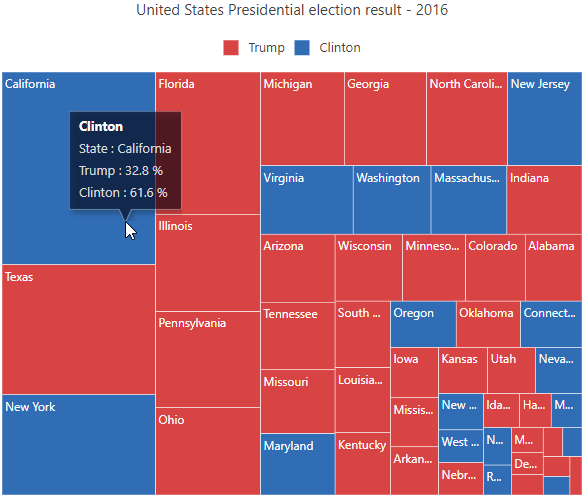
TreeMap information sourced from Wikipedia
In the above screenshot, leaf node size is calculated based on the population of the state and color is applied based on the winner of that state. In the tooltip, the name of the state and candidates vote percentage details are displayed.
Installation and configuration
The tree map control can be configured in TypeScript as follows:
- Clone the Essential JS 2 quick-start seed repository and configure the drop-down package in the system.config.js file.
"@syncfusion/ej2-base": "syncfusion:ej2-base/dist/ej2-base.umd.min.js",
"@syncfusion/ej2-data": "syncfusion:ej2-data/dist/ej2-data.umd.min.js",
"@syncfusion/ej2-svg-base": "syncfusion:ej2-svg-base/dist/ej2-svg-base.umd.min.js",
"@syncfusion/ej2-treemap": "syncfusion:ej2-treemap/dist/ej2-treemap.umd.min.js",
"@syncfusion/ej2-pdf-export": "syncfusion:ej2-pdf-export/dist/ej2-pdf-export.umd.min.js",
"@syncfusion/ej2-compression": "syncfusion:ej2-compression/dist/ej2-compression.umd.min.js",
"@syncfusion/ej2-file-utils": "syncfusion:ej2-file-utils/dist/ej2-file-utils.umd.min.js"
- Install the NPM packages using the following command.
- Clone the Essential JS 2 quick-start seed repository and configure the drop-down package in the system.config.js file.
$ npm install
- Add the HTML input element that needs to be initialized as a component in the index.html file.
- Initialize the component in the app.ts file.
import { TreeMap } from '@syncfusion/ej2-treemap';

// initialize treemap component
let treemap: TreeMap = new TreeMap();

// render initialized treemap
treemap.appendTo('#container');
Bind data source
Define an array of JavaScript objects as a data source to the tree map control. This data source will be further used to color the tree map, display data labels, display tooltips, and more. Assign this to the dataSource property.
let electionData: Object[] = [
    {  State: "Alabama", Trump: 62.9, Clinton: 34.6, Winner: "Trump", Population: 4780127 },
    {  State: "Alaska", Trump: 52.9, Clinton: 37.7, Winner: "Trump", Population: 710249},
    {  State: "Arkansas", Trump: 60.6, Clinton: 33.7, Winner: "Trump", Population: 2915958 },
    {  State: "Arizona", Trump: 49.5, Clinton: 45.4, Winner: "Trump", Population: 6392307 },
    {  State: "California", Trump: 32.8, Clinton: 61.6, Winner: "Clinton", Population: 37252895 },
    // ..
    {  State: "Washington", Trump: 4.1, Clinton: 92.8, Winner: "Clinton", Population: 6724543 },
    {  State: "Wisconsin", Trump: 68.7, Clinton: 26.5, Winner: "Trump", Population: 5687289 },
    {  State: "West Virginia", Trump: 47.9, Clinton: 46.9, Winner: "Clinton", Population: 1853011 },
    {  State: "Wyoming", Trump: 70.1, Clinton: 22.5, Winner: "Trump", Population: 583767 }
];

import { TreeMap } from '@syncfusion/ej2-treemap';
let treemap: TreeMap = new TreeMap({
    dataSource: electionData,
    weightValuePath: 'Population'
});
You should specify a field name available in the data source in the weightValuePath property and then the tree map item size will be calculated based on that value.
Specify height and width
The height and width of the tree map can be changed by specifying values for the height and width properties in the tree map. By default, the tree map will be rendered with 450px height and its parent container’s width.
import { TreeMap } from '@syncfusion/ej2-treemap';
let treemap: TreeMap = new TreeMap({
    height: '500',
    width: '600'
});
Define title
Specify an appropriate title and subtitle to provide additional information about the tree map. This can be done by specifying string values for the text property in titleSettings and subtitleSettings.
import { TreeMap } from '@syncfusion/ej2-treemap';
let treemap: TreeMap = new TreeMap({
    titleSettings: {
        text: 'United States Presidential election result - 2016'
    }
});
Mapping colors
The desired fill colors can be directly specified for the nodes. You can also apply colors based on desired conditions. Here, the field used for comparison is specified in the equalColorValuePath property. If the value of a node is Trump, then the color #D84444 will be applied to the shape. If the value of the shape is Clinton, then the color #316DB5 will be applied.
import { TreeMap } from '@syncfusion/ej2-treemap';
let treemap: TreeMap = new TreeMap({
    equalColorValuePath: 'Winner',
    leafItemSettings: {
        border: { color: 'white', width: 0.5 },
        colorMapping: [
            {
                value: 'Trump', color: '#D84444'
            },
            {
                value: 'Clinton', color: '#316DB5'
            }
        ]
    }
});
Display labels
Labels can be added for each tree map item to display additional information by specifying the field name in the data source for the labelPath property. If you didn’t specify a value for labelPath, then the weight value will be displayed as labels that can be hidden by specifying false for the showLabels property in leafItemSettings. In this screenshot, the names of the states are set to display in the labels.
import { TreeMap } from '@syncfusion/ej2-treemap';
let treemap: TreeMap = new TreeMap({
    leafItemSettings: {
        labelPath: 'State'
    }
});
Display legend
Legend items are rendered based on the color mapping values. In our example, this means the legend will be displayed based on the Trump and Clinton values specified in the color mapping. You can display the tree map legend by setting the visible property to true in legendSettings. As the legend in the tree map is a separate module, you will need to import and inject it before use.
import { TreeMap, TreeMapLegend } from '@syncfusion/ej2-treemap';
TreeMap.Inject(TreeMapLegend);
let treemap: TreeMap = new TreeMap({
    legendSettings: {
        visible: true,
        position: 'Top',
        shape: 'Rectangle'
    }
});
Enable tooltips
Tooltips can be enabled to display additional information about the nodes when the pointer hovers over them. The values displayed in a tooltip can be retrieved from the data source by specifying the data source’s field name in the format property and setting the visible property to true in tooltipSettings. If you didn’t specify a value for the format property, then the weight value of that node will be displayed in the tooltip. In the following screenshot, the winner, name of the state, and candidates vote percentages are displayed in the tooltip.
import { TreeMap, TreeMapTooltip } from '@syncfusion/ej2-treemap';
TreeMap.Inject(TreeMapTooltip);
let treemap: TreeMap = new TreeMap({
    tooltipSettings: {
        visible: true,
        format: '${Winner}
State : ${State}
Trump : ${Trump} %
Clinton : ${Clinton} %'
    }
});
The complete sample code is as follows.
let electionData: Object[] = [
    {  State: "Alabama", Trump: 62.9, Clinton: 34.6, Winner: "Trump", Population: 4780127 },
    {  State: "Alaska", Trump: 52.9, Clinton: 37.7, Winner: "Trump", Population: 710249},
    {  State: "Arkansas", Trump: 60.6, Clinton: 33.7, Winner: "Trump", Population: 2915958 },
    {  State: "Arizona", Trump: 49.5, Clinton: 45.4, Winner: "Trump", Population: 6392307 },
    {  State: "California", Trump: 32.8, Clinton: 61.6, Winner: "Clinton", Population: 37252895 },
    // ..
    {  State: "Washington", Trump: 4.1, Clinton: 92.8, Winner: "Clinton", Population: 6724543 },
    {  State: "Wisconsin", Trump: 68.7, Clinton: 26.5, Winner: "Trump", Population: 5687289 },
    {  State: "West Virginia", Trump: 47.9, Clinton: 46.9, Winner: "Clinton", Population: 1853011 },
    {  State: "Wyoming", Trump: 70.1, Clinton: 22.5, Winner: "Trump", Population: 583767 }
];

import { TreeMap, TreeMapTooltip, TreeMapLegend } from '@syncfusion/ej2-treemap';
TreeMap.Inject(TreeMapTooltip, TreeMapLegend);
let treemap: TreeMap = new TreeMap({
    width: '600',
    height: '500',
    titleSettings: {
        text: 'United States Presidential election result - 2016'
    },
    dataSource: electionData,
    weightValuePath: 'Population',
    equalColorValuePath: 'Winner',
    leafItemSettings: {
        labelPath: 'State',
        border: { color: 'white', width: 0.5 },
        colorMapping: [
            {
                value: 'Trump'  color: '#D84444'
            },
            {
                value: 'Clinton', color: '#316DB5'
            }
        ]
    },
    legendSettings: {
        visible: true,
        position: 'Top',
        shape: 'Rectangle'
    },
    tooltipSettings: {
        visible: true,
        format: '${Winner}
State : ${State}
Trump : ${Trump} %
Clinton : ${Clinton} %'
    }
});
An interactive version of this sample is available on Plunker.
Conclusion
In this blog post, we hope that you have learned how to visualize election results by creating a simple tree map and enhancing its basic features. The tree map control has many advanced features, such as rendering both flat/hierarchical data sources, data labels with wrap, trim and hide support, legend with default and interactive modes, three types of color mapping, label templates, and user-interactive features such as selection, highlighting, and drill-down. In future posts, we will see how easy it is to configure some of these advanced features.
If you have any questions or need any clarification, please let us know in the comments section below. You can also contact us through our support forum or Direct-Trac. We are always happy to assist you!
Helpful links
GitHub source: https://github.com/syncfusion/ej2-javascript-ui-controls/tree/master/controls/treemap
Interactive TreeMap demos: https://ej2.syncfusion.com/demos/#/material/treemap/default.html
Essential JS 2 TreeMap feature tour: https://www.syncfusion.com/javascript-ui-controls/treemap
If you like this blog post, we think you’ll also like the following free e-books: