
Hello everyone. In this post, I’ll be showing you how to include the Syncfusion Charts control in a Xamarin.Forms application and configure the elements of a chart.
The Syncfusion Charts control includes more than 30 chart types ranging from basic charts to financial charts. In this tutorial, I am going to use a bar chart to compare a sales target to actual sales, as shown in the following picture.
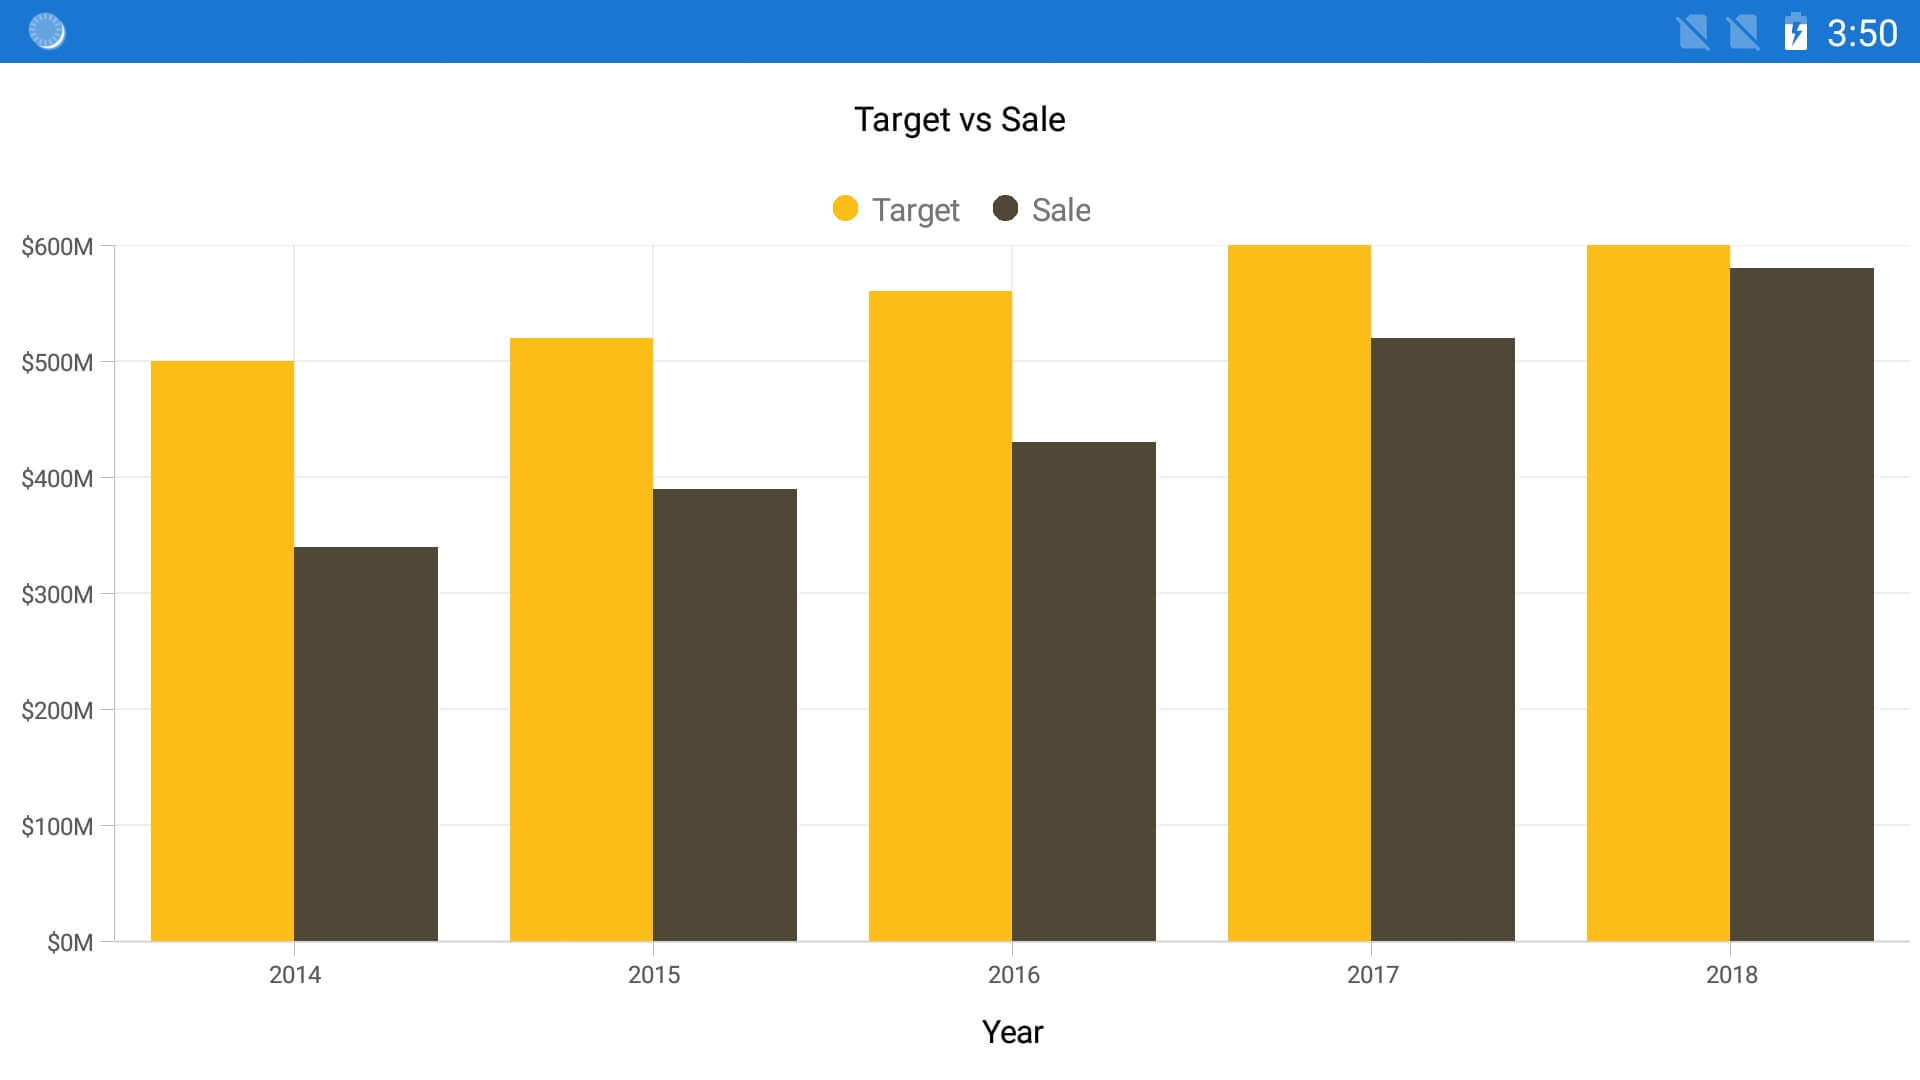
Target vs. Sale bar chart in a Xamarin.Forms app
Create Xamarin.Forms project
1. Open Visual Studio and create a new cross-platform project with the name ChartGettingStarted and choose .NET Standard as the code sharing strategy.
2. Create a model class named SalesInfo. It should represent a data point in a chart and should contain three properties to store year, sale, and target amounts.
public class SalesInfo
{
    public string Year { get; set; }
    public double Target { get; set; }
    public double Sale { get; set; }
}
3. Create a view model class named SalesViewModel and it should contain a list of SalesInfo objects in it.
public class SalesViewModel
{
    public List SalesData { get; set; }

    public SalesViewModel()
    {
        SalesData = new List();

        SalesData.Add(new SalesInfo { Year = "2014", Target = 500, Sale = 340 });
        SalesData.Add(new SalesInfo { Year = "2015", Target = 520, Sale = 390 });
        SalesData.Add(new SalesInfo { Year = "2016", Target = 560, Sale = 430 });
        SalesData.Add(new SalesInfo { Year = "2017", Target = 600, Sale = 520 });
        SalesData.Add(new SalesInfo { Year = "2018", Target = 600, Sale = 580 });
    }
}
Install NuGet package
Now, let’s add the SfChart NuGet from nuget.org:
1. Select Manage NuGet Packages for Solution in the context menu that appears when clicking right on the solution file in the Solution Explorer.
2. In the Browse tab, search for Syncfusion.Xamarin.SfChart in the search bar. This is the package that needs to be installed in all Xamarin.Forms projects.
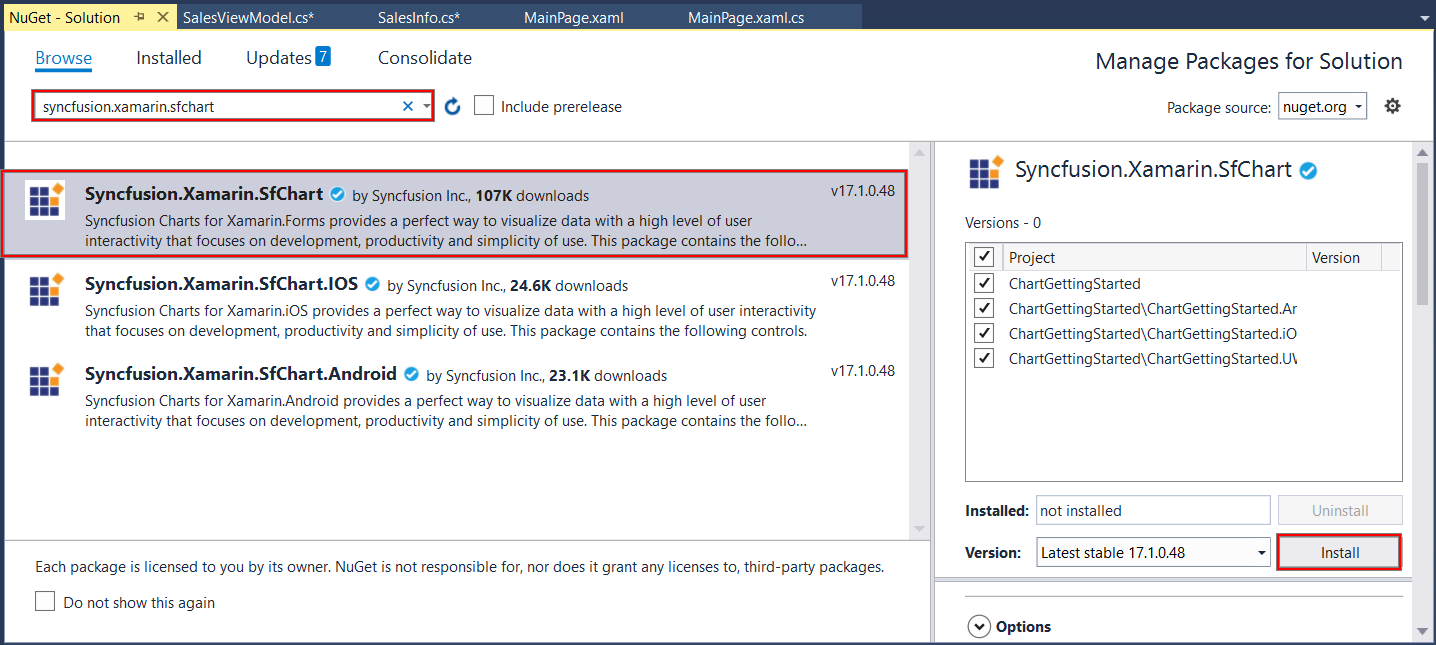
Syncfusion SfChart NuGet reference installation
3. Click Install. You’ll need to read and accept the license to finish installing.
The SfChart NuGet package will now be installed in all your Xamarin.Forms projects.
Initialize the chart and axis
Now, let’s configure the chart on the main page of the project:
1. First, set the binding context to bind the data between the ViewModel and the View. The ViewModel, in this case, will be SalesViewModel.
2. Next, add the namespace of Syncfusion chart on this page to access the SfChart classes. The SfChart class is available inside the Syncfusion.SfChart.XForms namespace.
<ContentPage xmlns="http://xamarin.com/schemas/2014/forms"
             xmlns:x="http://schemas.microsoft.com/winfx/2009/xaml"
             xmlns:local="clr-namespace:Automation_Sample"
             xmlns:chart="clr-namespace:Syncfusion.SfChart.XForms;assembly=Syncfusion.SfChart.XForms"
             x:Class="Automation_Sample.Page1">

    <ContentPage.BindingContext>
        <local:SalesViewModel/>
    </ContentPage.BindingContext>

</ContentPage>
3. Then, create an instance of SfChart using the alias name of the SfChart namespace we declared before.
4. Finally, define the x and y axes using the PrimaryAxis and SecondaryAxis properties:
a. The x-axis will show the years as a string, so set the CategoryAxis to the PrimaryAxis property.
b. The y-axis will show the amount, as it is a double value, so set a NumericalAxis to the SecondaryAxis property.
<chart:SfChart>
     <chart:SfChart.PrimaryAxis>
         <chart:CategoryAxis/>
     </chart:SfChart.PrimaryAxis>
     <chart:SfChart.SecondaryAxis>
         <chart:NumericalAxis/>
     </chart:SfChart.SecondaryAxis>
</chart:SfChart>
Since the series has not been added to the chart, the numerical axis is rendered with its default range of 0 to 1, and the category axis does not have any default labels.
Add series
Next, we need to add the series to visualize the data. As I am going to compare the target and sales values, two column series need to be added to the chart to visualize those values:
1. Add the first column series and bind the data from the ViewModel using the ItemsSource property. The SalesData property is declared in the ViewModel class.
2. The XBindingPath and YBindingPath properties are used to map the properties to fetch the values from the model object. Set the XBindingPath path to Year and the YBindingPath to Target. These properties are declared in the model object.
<ContentPage.BindingContext>
        <local:SalesViewModel/>
</ContentPage.BindingContext>

<chart:SfChart>
     <chart:SfChart.PrimaryAxis>
         <chart:CategoryAxis/>
     </chart:SfChart.PrimaryAxis>
     <chart:SfChart.SecondaryAxis>
         <chart:NumericalAxis/>
     </chart:SfChart.SecondaryAxis>
     <chart:SfChart.Series>
         <chart:ColumnSeries ItemsSource="{Binding SalesData}"
                             XBindingPath="Year"
                             YBindingPath="Target">
         </chart:ColumnSeries>
     </chart:SfChart.Series>
</chart:SfChart>
Let’s add one more column series to visualize the sales values:
1. Pull the sales data from the same binding context as before.
2. Set the XBindingPath to Year, and the YBindingPath to Sale for this series.
<ContentPage.BindingContext>
        <local:SalesViewModel/>
</ContentPage.BindingContext>

<chart:SfChart>
     <chart:SfChart.PrimaryAxis>
         <chart:CategoryAxis/>
     </chart:SfChart.PrimaryAxis>
     <chart:SfChart.SecondaryAxis>
         <chart:NumericalAxis/>
     </chart:SfChart.SecondaryAxis>
     <chart:SfChart.Series>
         <chart:ColumnSeries ItemsSource="{Binding SalesData}"
                             XBindingPath="Year"
                             YBindingPath="Target">
         </chart:ColumnSeries>
         <chart:ColumnSeries ItemsSource="{Binding SalesData}"
                             XBindingPath="Year"
                             YBindingPath="Sale">
         </chart:ColumnSeries>
     </chart:SfChart.Series>
</chart:SfChart>
Add a title and legend
Then, to make this chart more meaningful, let’s configure the title and legend to represent each series:
1. Set an instance of ChartTitle to the Title property of SfChart. The title will be Target vs Sale.
2. Enable the legend using the Legend property of SfChart. The empty legend icons are added to the chart with different colors identifying the series. But we need labels to tell us what the colors represent.
3. Configure the labels using the Label property in each of the column series. We’ll name the first series Target and second series Sale.
<chart:SfChart>
    <chart:SfChart.Title>
        <chart:ChartTitle Text="Target vs Sale"/>
    </chart:SfChart.Title>
    <chart:SfChart.Series>
        <chart:ColumnSeries ItemsSource="{Binding SalesData}"
                            XBindingPath="Year"
                            YBindingPath="Target"
                            Label="Target">
        </chart:ColumnSeries>
        <chart:ColumnSeries ItemsSource="{Binding SalesData}"
                            XBindingPath="Year"
                            YBindingPath="Sale"
                            Label="Sale">
        </chart:ColumnSeries>
    </chart:SfChart.Series>

    <chart:SfChart.Legend>
       <chart:ChartLegend/>
    </chart:SfChart.Legend>
</chart:SfChart>
Customize the axis
Now let’s customize the axis by setting the title and format of the labels. We’ll set the title as Year for the primary axis using the Title property of CategoryAxis.
<chart:SfChart>
    <chart:SfChart.PrimaryAxis>
        <chart:CategoryAxis>
            <chart:CategoryAxis.Title>
                <chart:ChartAxisTitle Text="Year"/>
            </chart:CategoryAxis.Title>
        </chart:CategoryAxis>
    </chart:SfChart.PrimaryAxis>
    <chart:SfChart.SecondaryAxis>
        <chart:NumericalAxis/>
    </chart:SfChart.SecondaryAxis>
</chart:SfChart>
Then, let’s format the labels of the y-axis to show the dollar ($) symbol and represent the numbers in terms of millions. We can use the LabelStyle property to customize the axis labels. Set an instance of ChartAxisLabelStyle to the LabelStyle property. Format the label with the dollar sign, three-digit values, and M symbols.
<chart:SfChart>
    <chart:SfChart.PrimaryAxis>
        <chart:CategoryAxis>
            <chart:CategoryAxis.Title>
                <chart:ChartAxisTitle Text="Year"/>
            </chart:CategoryAxis.Title>
        </chart:CategoryAxis>
    </chart:SfChart.PrimaryAxis>
    <chart:SfChart.SecondaryAxis>
        <chart:NumericalAxis>
            <chart:NumericalAxis.LabelStyle>
                <chart:ChartAxisLabelStyle LabelFormat="$###M"/>
            </chart:NumericalAxis.LabelStyle>
        </chart:NumericalAxis>
    </chart:SfChart.SecondaryAxis>
</chart:SfChart>
You can now run this on an Android phone to see the chart.
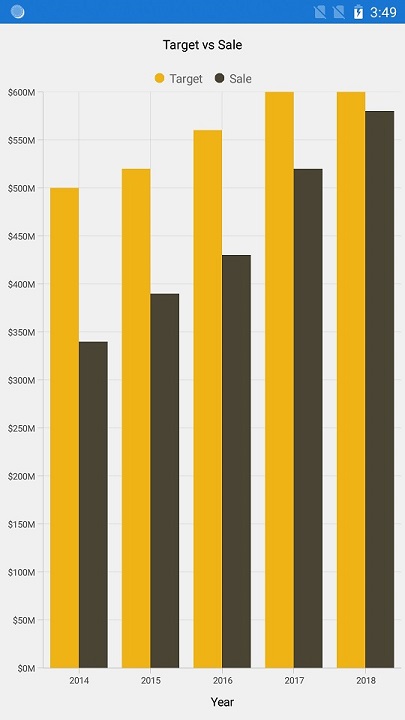
The chart in an Android app
Deploy for iOS
Now we want to run the same app in an iPhone simulator. Before running it on an iOS platform, though, we need to take one additional step in the iOS project to load the assemblies of the renderer projects:
1. In the Solution Explorer, go to the iOS project and open the App.Delegate.cs file.
2. Inside the FinishedLaunching method, and after invoking the Xamarin.Forms Init method, call the Init method of SfChartRenderer.
public override bool FinishedLaunching(UIApplication app, NSDictionary options)
{
  ...
  global::Xamarin.Forms.Forms.Init();
  Syncfusion.SfChart.XForms.iOS.Renderers.SfChartRenderer.Init();
  LoadApplication(new App());
  ...
}
3. Then, set the iOS project as the startup project and deploy the application. The output will be similar to the output we got on Android.
Deploy for UWP
Lastly, we’ll deploy this app in the UWP platform to make sure that we are getting the same appearance of the chart there, too. We just set the UWP project as the startup project and run it in the local machine.
This is the actual output of Xamarin.Forms Charts in a UWP application.
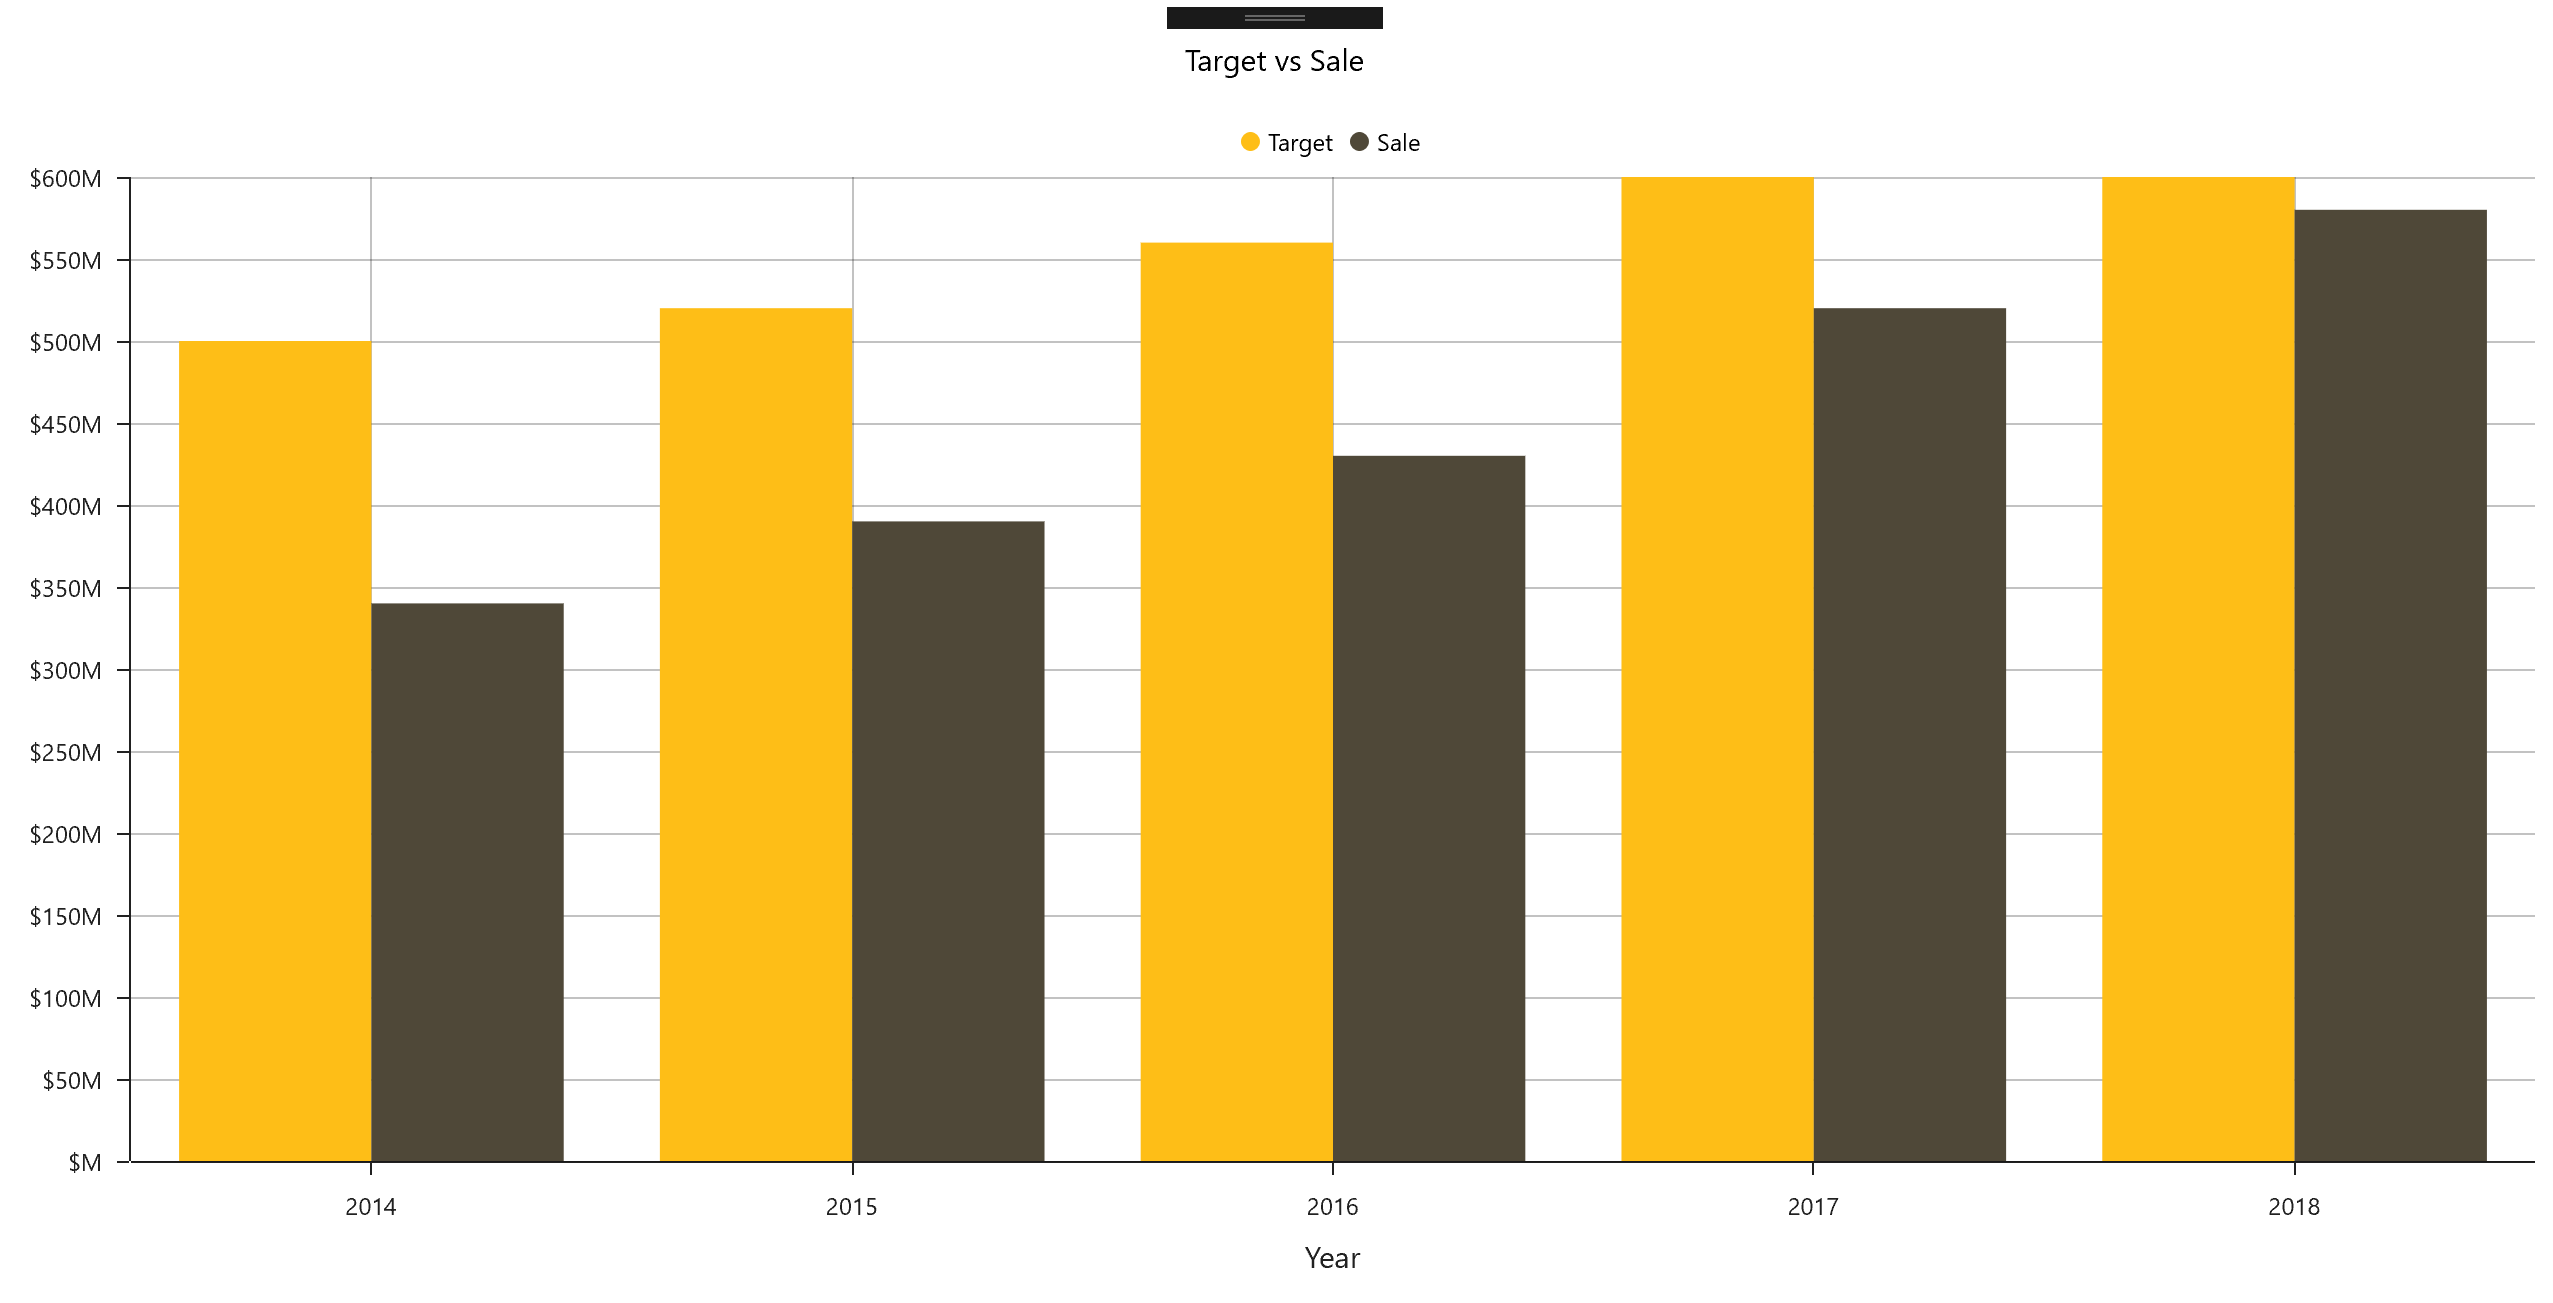
The chart in a UWP app
I hope this post was helpful in getting you started with the Charts control in Xamarin.Forms. If you have any requests for our next tutorial, please share them in the comments section below. You can download this sample project from here.
If you like this post, we think you’ll also enjoy:
[Ebook] Xamarin.Forms Succinctly


Comments (1)
nice one. thanks
Comments are closed.