
Org charts are graphical representations of organizational structures. Their purpose is to illustrate the relationships and relative ranks of positions within an organization. An org chart may also be referred to as an organization chart, organizational chart, or hierarchy tree or chart.
Are you looking for a JavaScript library to create an org chart with less effort and which is very effective? Then you are in the right place, because the Syncfusion JavaScript Diagram Library helps you do that with easy configuration settings. In this blog, I will walk you through the steps involved in the creation of an org chart using the Syncfusion Diagram Library.
Getting Started with a Simple Org Chart
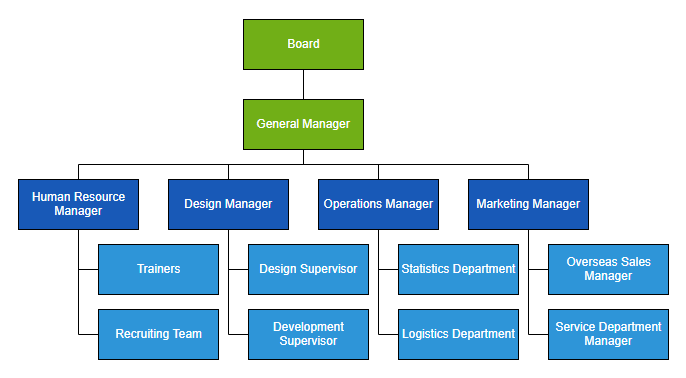
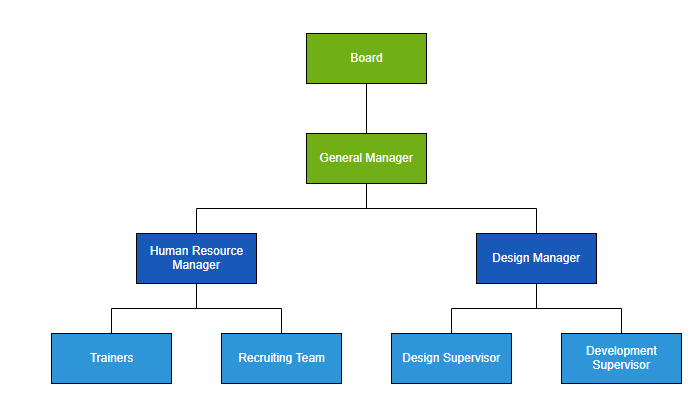
Let’s create a simple org chart as shown in the below image using the Syncfusion Diagram Library. The Diagram control has a high-performing layout algorithm to arrange parent and children elements. It can load and lay out up to 1,000 nodes and 1,000 connectors in two to three seconds.
The Diagram control supports visualizing an org chart from the data source. This avoids having to manually feed data to individual nodes. The data source should be defined in JSON format and configured to the diagram.
- Please refer to our help documentation to learn more about the dependent scripts and theme files required to integrate the Diagram control in a JavaScript application.
- Define the employee information as a JSON array
- Create an instance of the Diagram control.
- Configure the data to the dataSourceSettings property of the created diagram instance.
- In the Diagram control, the rectangular boxes shown in the screenshot represent nodes, and lines represent connectors. The text inside the rectangular box represents annotations.
- When each node is created, the dataSourceSettings doBinding method will trigger. You can use this method to configure the employee information inside the node.
- Since all the nodes have the same width and height, you can define the common formatting for all nodes through the getNodeDefaults method. Likewise, you can define the common formatting properties for connectors through the getConnectorDefaults method.
- After configuring the data source, define layout type to arrange the parent and child nodes positions automatically.
The code example below includes all the previously discussed steps. The full sample is available on he inline demo here:
import {data} from './datasource.js';

var items = new ej.data.DataManager(data);

var diagram = new ej.diagrams.Diagram({
    width: "1000px",
    height: "600px",
    dataSourceSettings: {
        // set the unique field from data source
        id: 'id',
        // set the field which is used to identify the reporting person
        parentId: 'manager',
        // define the employee data
        dataManager: items,
        doBinding: function (node, data) {
            // You will get the employee information in data argument and bind that value directly to node's built-in properties.
            node.annotations = [{ content: data.role }];
            node.style = { fill: data.color };
        }
    },
    layout: {
        // set the layout type
        type: 'OrganizationalChart'
    },
    // set the common settings for node and connector
    getNodeDefaults: nodeDefaults,
    getConnectorDefaults: connectorDefaults,
    // hide the gridlines in the diagram
    snapSettings: { constraints: ej.diagrams.SnapConstraints.None }
});
diagram.appendTo('#diagram');

function nodeDefaults(node) {
    node.annotations[0].style.color = "white";
    node.width = 120;
    return node;
}

function connectorDefaults(connector) {
    connector.type = 'Orthogonal';
    connector.targetDecorator = { shape: 'None' };
    return connector;
}
Features & Examples
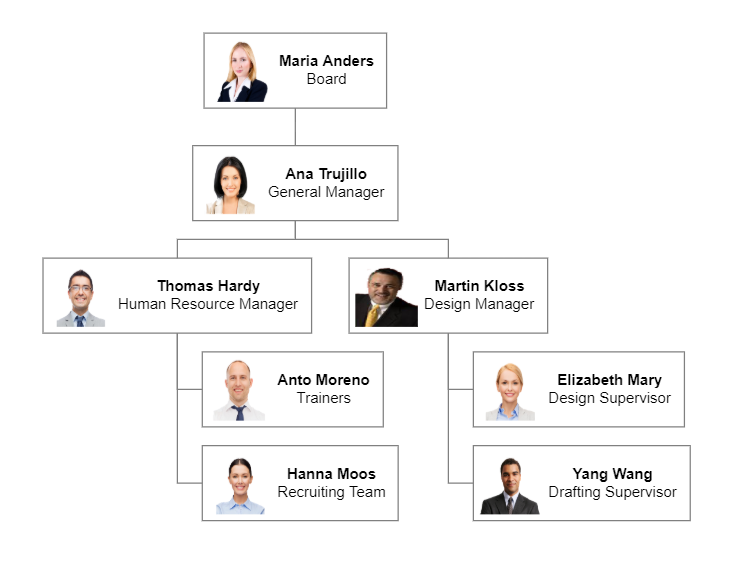
Org Chart Shape Customization
You can easily create different types of org charts shapes and visualize them with custom UI design.
The setNodeTemplate method allows you to define a custom template for org chart. Please refer to the below code example for details.
//Funtion to add the Template of the Node.
function setNodeTemplate(obj, diagram) {
    // create the stack panel
    var content = new ej.diagrams.StackPanel();
    content.id = obj.id + '_outerstack';
    content.orientation = 'Horizontal';
    content.style.strokeColor = 'gray';
    content.padding = { left: 5, right: 10, top: 5, bottom: 5 };

    // create the image element to map the image data from the data source
    var image = new ej.diagrams.ImageElement();
    image.id = obj.id + '_pic';
    image.width = 50; image.height = 50; image.style.strokeColor = 'none';
    image.source = obj.data.ImageUrl;

    // create the stack panel to append the text elements.
    var innerStack = new ej.diagrams.StackPanel();
    innerStack.style.strokeColor = 'none';
    innerStack.margin = { left: 5, right: 0, top: 0, bottom: 0 };
    innerStack.id = obj.id + '_innerstack';

    // create the text element to map the Name data from the data source
    var text = new ej.diagrams.TextElement();
    text.style.bold = true;
    text.id = obj.id + '_name';
    text.content = obj.data.Name;

    // create the text element to map the designation data from the data source
    var desigText = new ej.diagrams.TextElement();
    desigText.id = obj.id + '_desig';
    desigText.content = obj.data.Designation;

    // append the text elements
    innerStack.children = [text, desigText];

    // append the image and inner stack elements
    content.children = [image, innerStack];
    return content;
}
Customized Org Chart
The full sample code is available here:
Expand and Collapse
Use the expandIcon and collapseIcon properties of nodes to implement the expand and collapse features of the tree-shaped org chart. The following code example illustrates this.
function nodeDefaults(node) {
  ….
  node.expandIcon = { shape: 'Minus' };
  node.collapseIcon = { shape: 'Plus' };
  return node;
}
Expand and Collapse Org Chart
The full sample for this feature is available here:
Drag-and-Drop (Editing Hierarchy Interactively)
You can easily modify the org chart interactively by dragging the child or parent nodes and dropping them at the desired locations. To enable editing of the hierarchical structure of the org chart, add the following code in the drop method of the Diagram control.
var diagram = new ej.diagrams.Diagram({
    ...
    // trigger the drop event to update the org chart structure when drag and drop the child node.
    drop: drop
  });

function drop(args) {
    if (args.target && args.target instanceof ej.diagrams.Node) {
        var connector = diagram.getObject(args.element.inEdges[0]);
        connector.sourceID = args.target.id;
        diagram.dataBind();
        diagram.doLayout();
        // update your local data source when modifying org chart structure.
        updateDataSource(args.element, args.target);
    }
}

function updateDataSource(source, target) {
    var updateData = data.find(function(element) {
        return element.id === source.data.id;
    });
    if(updateData) {
      updateData.manager = target.data.id;
    }
}
Drag and Drop nodes in Org Chart
The full sample is available here.
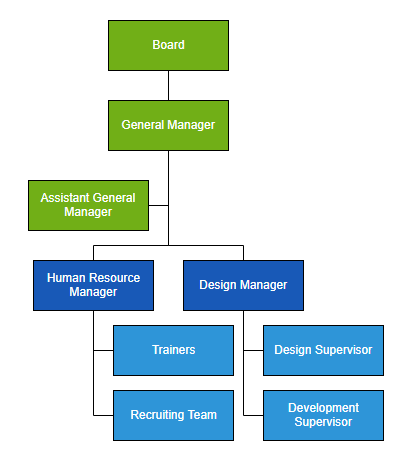
Assistants
The Diagram control supports defining assistants in the org chart. Assistants are child items that have a different relationship with the parent node. They are laid out in a dedicated part of the tree.
The layout’s getLayoutInfo method will be triggered when positioning each node on the layout, and it takes node and tree information as the arguments. Use this method to specify a node as an assistant node. Refer to the following code example for a demonstration.
var diagram = new ej.diagrams.Diagram({
    ...
    layout: {
        type: 'OrganizationalChart',
        getLayoutInfo: function (node, options) {
            // you can get the children belongs to the parent node and decide the assistants from that children.
            if (node.data.role === 'General Manager') {
                options.assistants.push(options.children[2]);
                options.children.splice(2, 1);
            }
        }
    },

});
Assistants in Org Chart
The full sample is available here.
Orientation & Alignment
You can arrange the organizational chart with different orientations, such as top-to-bottom, left-to-right, right-to-left, and bottom-to-top as needed. Leaf-level nodes of the org chart can be aligned either horizontally or vertically. Nodes can be aligned to the left, right, or center horizontally and to the top, bottom, or middle vertically. You can customize the horizontal and vertical spacing between each level.
Please refer to the following code example to set the orientation and customize leaf-level node alignment.
var diagram = new ej.diagrams.Diagram({
    ...
    layout: {
      type: 'OrganizationalChart',
      // set the layout orientation
      orientation: 'TopToBottom',
      // set the spacing between each level in horizontal and vertical direction
      horizontalSpacing: 50, verticalSpacing: 50,
      getLayoutInfo: function (node, options) {
          // set the leaf-level node alignment
          if (!options.hasSubTree) {
              options.orientation = 'Horizontal';
              options.type = 'Center';
          }
      }

    },

});
Orientation & Alignment – Org Chart
The full sample is available here.
Zooming and Panning
Viewing a large org chart on a small screen can be quite difficult. Zooming and panning support helps to provide a better view of the chart.
Use Ctrl + mouse wheel operation to zoom in and out on the diagram. To activate zooming and panning support in the Diagram control, use the following code example.
var diagram = new ej.diagrams.Diagram({
    // enable the pan tool
    tool: ej.diagrams.DiagramTools.ZoomPan
});
Zoom and pan org chart
The full sample is available here.
Exporting
You can easily export the diagram to different image formats such as PNG, JPEG, BMP, and SVG.
Please refer to the below code example and demo link to explore this feature.
diagram.exportDiagram({format: 'PNG', fileName: 'OrgChart'});
The full sample is available here.
Lazy Loading
Loading very large data sets in a diagram can be time-consuming. Use the lazy loading UI virtualization technique to load only the objects that lay on the viewport. This allows the diagram to load and display large data within a second.
To enable the virtualization feature, please use the following code example.
var diagram = new ej.diagrams.Diagram({
    // enable virtualization
    constraints: ej.diagrams.DiagramConstraints.Default | ej.diagrams.DiagramConstraints.Virtualization,
});
diagram.appendTo('#diagram');
The full sample is available here.

Conclusion
In this blog post, we have seen how to create and customize organizational charts using the Syncfusion JavaScript Diagram Library. If you would like to try the Diagram Library, you can download our free trial. You can visit the Diagram Library source in GitHub and check our live demo and documentation for detailed explanations.
If you have any questions, please let us know in the comments section below. You can also contact us through our support forum, support portal, or feedback portal. We are always happy to assist you!


Comments (7)
Hello is it possible to give two parents to a child for eg. trainers under human resource management have design manager as their parent too
Hi SAAD,
If you need to have multiparent layout in the diagram control, then you should set layout type as ComplexHierarichalTree instead of OrganizationalChart. In the below sample, we had set two parents for the Trainers child. Please refer to a code example below.
Code example:
export var data = [
{ ‘id’: ‘parent’, ‘role’: ‘Board’, ‘color’: ‘#71AF17’ },
{ ‘id’: ‘1’, ‘role’: ‘General Manager’, ‘manager’: ‘parent’, ‘color’: ‘#71AF17’ },
{ ‘id’: ‘2’, ‘role’: ‘Human Resource Manager’, ‘manager’: ‘1’, ‘color’: ‘#1859B7’ },
{ ‘id’: ‘3’, ‘role’: ‘Trainers’, ‘manager’: [‘2’, ‘6’], ‘color’: ‘#2E95D8’ },
{ ‘id’: ‘6’, ‘role’: ‘Design Manager’, ‘manager’: ‘1’, ‘color’: ‘#1859B7’ }
];
Sample: https://stackblitz.com/edit/1woeqw-heyenr?file=index.js
I hope this helps.
Regards,
Kamesh R
I have tried to export from localhost, But it is throwing error at console.
Hi,
We have created a sample to export the diagram as an image and it is working fine in our end. We have attached the same for your reference in the below link. If you still face any issues, please modify the below sample and share the same with us.
Sample: https://www.syncfusion.com/downloads/support/directtrac/general/ze/exportSample925295248
Regards,
Kamesh R.
Hi
How To display a link i mean Href.I want to display a href or link just below the designation.
Hi Robert Das,
Please use annotations hyperlink link property to display the href/link in the node. We have created a sample to achieve your requirement. Please refer to a code example and the sample below.
Code example:
export var data = [
{ ‘id’: ‘parent’, ‘role’: ‘Board’, ‘color’: ‘#71AF17’, ‘link’:’https://www.syncfusion.com’ },
{ ‘id’: ‘1’, ‘role’: ‘General Manager’, ‘manager’: ‘parent’, ‘color’: ‘#71AF17’, ‘link’:’https://help.syncfusion.com’ },
{ ‘id’: ‘2’, ‘role’: ‘Human Resource Manager’, ‘manager’: ‘1’, ‘color’: ‘#1859B7’, ‘link’:’https://www.syncfusion.com’ },
{ ‘id’: ‘3’, ‘role’: ‘Trainers’, ‘manager’: [‘2′,’6’], ‘color’: ‘#2E95D8’, ‘link’:’https://www.syncfusion.com’ },
{ ‘id’: ‘6’, ‘role’: ‘Design Manager’, ‘manager’: ‘1’, ‘color’: ‘#1859B7’, ‘link’:’https://www.syncfusion.com’ }
];
var diagram = new ej.diagrams.Diagram({
width: “1000px”,
height: “600px”,
dataSourceSettings: {
id: ‘id’, parentId: ‘manager’, dataManager: items,
doBinding: function (node, data) {
// You will get the employee information in data argument and bind that value directly to node’s built-in properties.
node.annotations = [{ content: data.role, offset:{x:0.5,y:0.3} }, { hyperlink:{link:data.link, content: ‘hyperlink’} , offset:{x:0.5,y:0.7}}];
node.style = { fill: data.color };
}
},
});
diagram.appendTo(‘#diagram’);
Sample: https://stackblitz.com/edit/1woeqw-fo9txu?file=index.js
Help documentation: https://ej2.syncfusion.com/documentation/diagram/labels/?no-cache=1#hyperlink
Regards,
Kamesh R.
Hi Kamlesh
Thanks You very much for sharing this.It works for normal link. But if i try to call a javascript from that link its not working,Any ideas.
Regards
Robertson
Comments are closed.