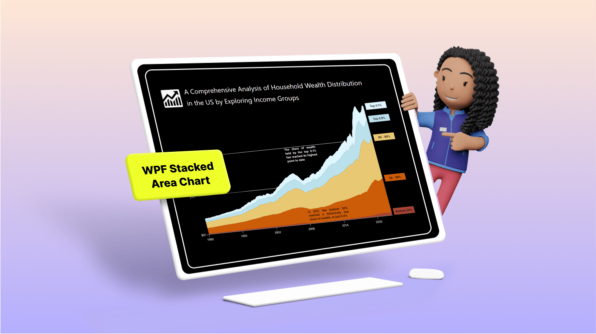
Chart of the Week: Creating a WPF Stacked Area Chart to Visualize Wealth Distribution in the U.S. Arul Jenith Berkmans April 17, 2024
Chart of the Week: Creating a Custom .NET MAUI Bar Chart for Global Renewable Energy Employment Trends Vimala Thirumalai Kumar April 10, 2024
Chart of the Week: Creating a WPF 3D Column Chart to Visualize the Panama Canal’s Shipment Transit Data Surya Karan Raja April 7, 2024
Chart of the Week: Creating a .NET MAUI Column Chart to Visualize the Corporate Investment in AI Saiyath Ali Fathima M March 27, 2024
Chart of the Week: Creating a .NET MAUI Fast Line Chart to Visualize the Arctic Sea Ice Extent Since 2000 Sneha Kumar March 21, 2024
Chart of the Week: Creating a WPF Chart Dashboard to Visualize the 2023 World Billionaires List Sowndharya Selladurai March 19, 2024
Chart of the Week: Create a .NET MAUI Column Chart to Visualize which Milk Is the Most Sustainable Saiyath Ali Fathima M March 7, 2024
Chart of the Week: Creating a WPF Bar Chart to Visualize the Homelands of America’s International Students Saiyath Ali Fathima M February 21, 2024
Chart of the Week: Creating a .NET MAUI Bar Chart for the US’s Most Traded Goods with China Arul Jenith Berkmans February 14, 2024
Chart of the Week: Creating a WPF Stacked Bar Chart to Visualize the Social Media Use of US Teens in 2023 Karthikeyan V February 7, 2024
Chart of the Week: Create a .NET MAUI Stacked Column Chart for the Top-Earning Female Athletes Dhanaraj Rajendran February 1, 2024