One of the most important features in Essential JS 2 maps control is a built-in online map provider support. By using this feature, you can render OpenStreetMaps, Bing maps, or maps from other providers in the maps control. This provides the ability to visualize satellite, aerial, and street maps, or other kinds of imagery tiles, without using any external shape files. By using these external services, the map data can be located easily.
OpenStreetMap
The OpenStreetMap (OSM) is the world map built by a community of mappers; it is free to use under an open license. It allows you to view geographical data in a collaborative way from anywhere on the earth. The OSM map provides small tile images based on our requests and combines those images into a single image to display the map area in the maps control.
To use OSM, add a layer in maps layers collection, and set the layerType to OSM as shown in the following code.
let maps: Maps = new Maps({
    layers: [
        {
            layerType: 'OSM'
        }
    ]
});
Bing maps
Bing maps is a map of the entire world owned by Microsoft. As with OSM, it provides map tile images based on our requests and combines those images into a single one to display a map area. To use Bing maps, set the layerType to Bing, and set the Bing maps key (which can be obtained here) to key property as shown in the following code.
let maps: Maps = new Maps({
    layers: [
        {
            layerType: 'Bing',
            key: ''
            // Need to create Bing maps key and set to key property.
        }
    ]
});
The maps control supports six types of viewing style options in Bing maps: Aerial, AerialWithLabel, Road, CanvasDark, CanvasLight, and CanvasGray. The default view of the Bing maps style is Aerial.
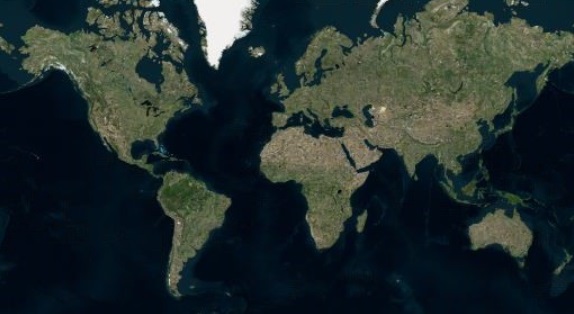
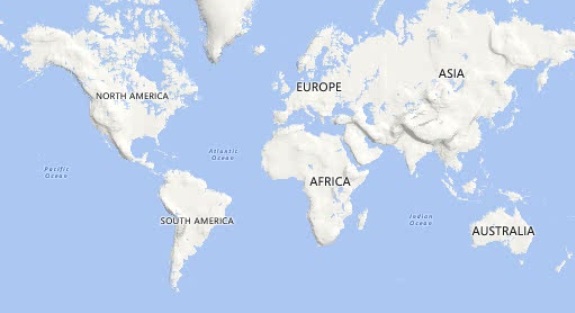
Aerial
Aerial view displays satellite images to highlight roads and major landmarks for easy identification. To render the Aerial view, set the bingMapType to Aerial as shown in the following code.
let maps: Maps = new Maps({
    layers: [
        {
            layerType: 'Bing',
            bingMapType: 'Aerial',
            key: ''
            // Need to create Bing maps key and set to key property.
        }
    ]
});
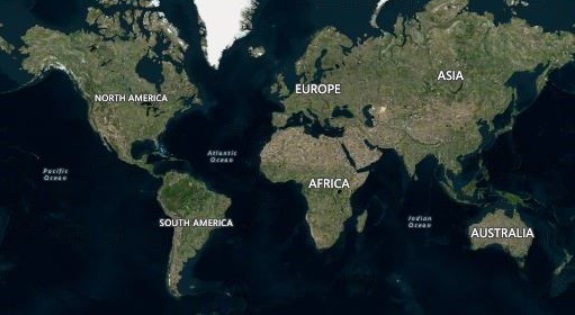
AerialWithLabel
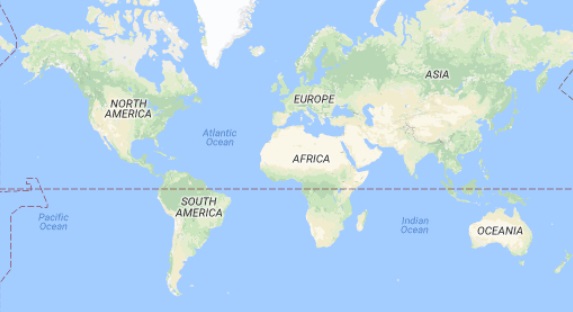
The AerialWithLabel view displays the Aerial map with labels for the continent, country, ocean, etc. To render this type of view, set the bingMapType to AerialWithLabel as shown in the following code.
let maps: Maps = new Maps({
    layers: [
        {
            layerType: 'Bing',
            bingMapType: 'AerialWithLabel',
            key: ''
            // Need to create Bing maps key and set to key property.
        }
    ]
});
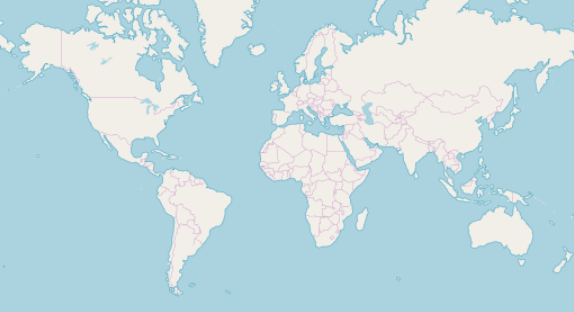
Road
The Road view displays the default map view of roads, buildings, and geography. To render the Road view, set the bingMapType to Road as shown in the following code.
let maps: Maps = new Maps({
    layers: [
        {
            layerType: 'Bing',
            bingMapType: 'Road',
            key: ''
            // Need to create Bing maps key and set to key property.
        }
    ]
});
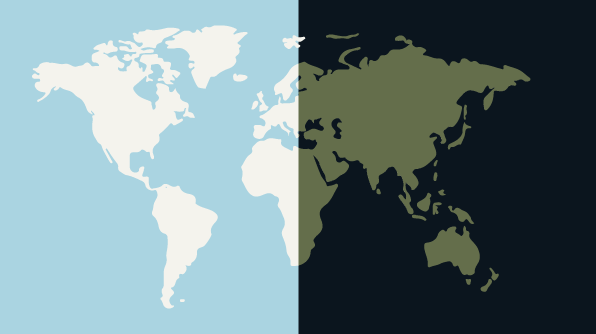
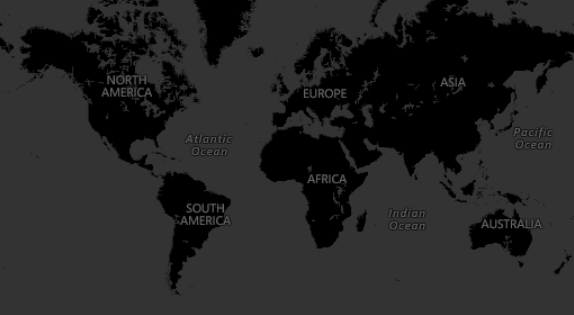
CanvasDark
CanvasDark is a dark version of the road maps. To render this view, set the bingMapType to CanvasDark as shown in the following code.
let maps: Maps = new Maps({
    layers: [
        {
            layerType: 'Bing',
            bingMapType: 'CanvasDark',
            key: ''
            // Need to create Bing maps key and set to key property.
        }
    ]
});
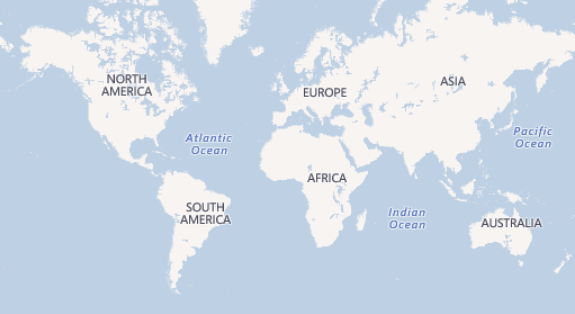
CanvasLight
CanvasLight is a light version of the road maps. To render this view, set the bingMapType to CanvasLight as shown in the following code.
let maps: Maps = new Maps({
    layers: [
        {
            layerType: 'Bing',
            bingMapType: 'CanvasLight',
            key: ''
            // Need to create Bing maps key and set to key property.
        }
    ]
});
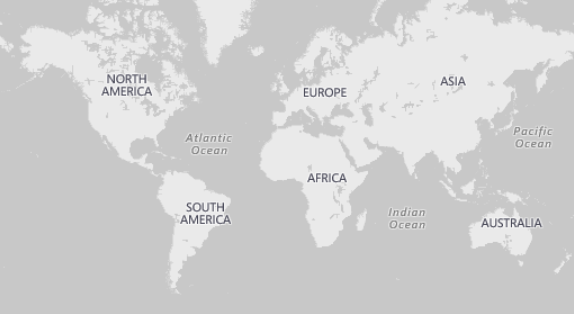
CanvasGray
CanvasGray is a grayscale version of the road maps. To render this view, set the bingMapType to CanvasGray as shown in the following code.
let maps: Maps = new Maps({
    layers: [
        {
            layerType: 'Bing',
            bingMapType: 'CanvasGray',
            key: ''
            // Need to create Bing maps key and set to key property.
        }
    ]
});
Other map providers
As well as OSM and Bing maps, you can also render maps from other map service providers using Essential JS 2 maps control by specifying the layerType as OSM and the URL generated by the map provider in the urlTemplate property. Here, we have rendered Google maps. (Refer to Google maps licensing here).
let maps: Maps = new Maps({
    layers: [{
        layerType: 'OSM',
        urlTemplate: 'http://mt1.google.com/vt/lyrs=m@129&hl=en&x=tileX&y=tileY&z=level'
    }]
});
Functionalities on OSM/Bing maps
Apart from rendering, Essential JS 2 maps control also provides various functionalities to OSM/Bing maps layers such as zooming and panning support, placing markers, rendering navigation lines, sublayers, etc.
Zooming and panning
You can zoom and pan the OSM/Bing maps layer. Zooming helps you get a closer look at a particular area on a map for in-depth analysis. Panning helps you to move a map around to focus the targeted area.

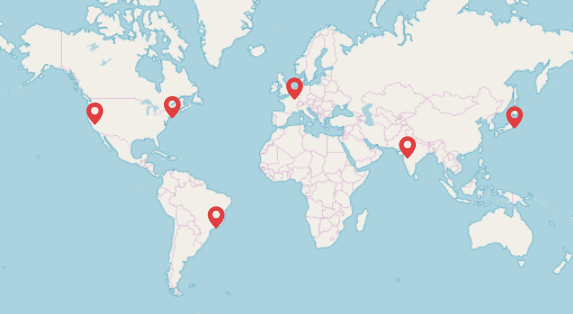
Markers
Markers can be added to the layers of OSM/Bing maps by setting the corresponding location’s coordinates of latitude and longitude. The type of marker can be changed to built-in shapes such as circles, diamonds, rectangles, etc. Custom HTML elements can also be added as markers to highlight a location.
let maps: Maps = new Maps({
    layers: [{
        layerType: 'OSM',
        markerSettings: [{
            visible: true,
            dataSource: [
                { latitude: 37.6276571, longitude: -122.4276688 },
                { latitude: 40.7424509, longitude: -74.0081468 },
                { latitude: -23.5268201, longitude: -46.6489927 },
                { latitude: 48.8773406, longitude: 2.3299627 },
                { latitude: 19.1555762, longitude: 72.8849595 },
                { latitude: 35.6628744, longitude: 139.7345469 }
            ],
            shape: 'Balloon',
            fill: '#E13E40',
            height: 20,
            width: 15
        }]
    }]
});
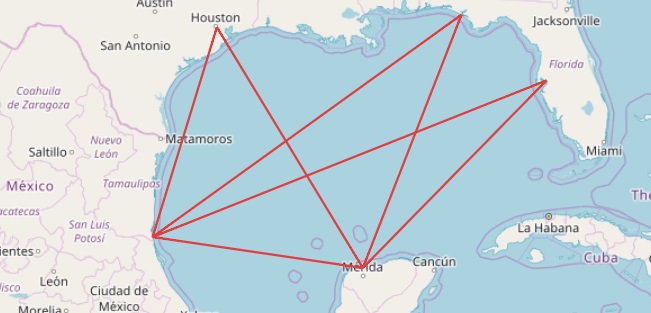
Navigation lines
You can add navigation lines on top of an OSM/Bing maps layer for highlighting a path among various places by setting the corresponding locations’ coordinates of latitude and longitude in the navigationLineSettings property.
let maps: Maps = new Maps({
    zoomSettings: {
        zoomFactor: 5
    },
    centerPosition: {
        latitude: 24.0902,
        longitude: -90.7129
    },
    layers: [{
        layerType: 'OSM',
        navigationLineSettings: [
        {
            visible: true, angle: 0, color: '#E13E40',
            latitude: [22.403410892712124, 29.756032197482973], longitude: [-97.8717041015625, -95.36270141601562],
        },
        {
            visible: true, angle: 0, color: '#E13E40',
            latitude: [22.403410892712124, 30.180747605060766 ], longitude: [-97.8717041015625, -85.81283569335938]
        },
        {
            visible: true, angle: 0, color: '#E13E40',
            latitude: [22.403410892712124, 27.9337540167772], longitude: [-97.8717041015625, -82.49908447265625]
        },
        {
            visible: true, angle: 0, color: '#E13E40',
            latitude: [22.403410892712124, 21.282336521195344], longitude: [-97.8717041015625, -89.6649169921875]
        },
        {
            visible: true, angle: 0, color: '#E13E40',
            latitude: [29.756032197482973, 21.282336521195344], longitude: [-95.36270141601562, -89.6649169921875]
        },
        {
            visible: true, angle: 0, color: '#E13E40',
            latitude: [30.180747605060766, 21.282336521195344], longitude: [-85.81283569335938, -89.6649169921875]
        },
        {
            visible: true, angle: 0, color: '#E13E40',
            latitude: [27.9337540167772, 21.282336521195344], longitude: [-82.49908447265625, -89.6649169921875]
        }]
    }]
});
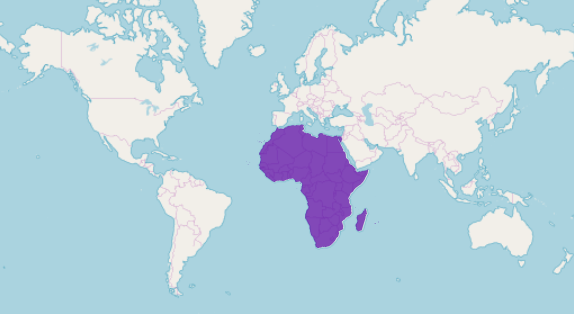
Sublayers
You can render any GeoJSON shape as a sublayer on top of an OSM maps layer for highlighting a particular continent or country in OSM/Bing maps by adding another layer and specifying the type to SubLayer.
let maps: Maps = new Maps({
    zoomSettings: {
        zoomFactor: 1
    },
    layers: [{
        layerType: 'OSM',
    },
    {
        type: 'SubLayer',
        // GeoJSON data to render the African continent.
        shapeData: [{ }],
        shapeSettings: {
            fill: '#5100a3',
            opacity: 0.7
        }
    }]
});
An interactive version of an OSM sample is available on Plunker: https://plnkr.co/edit/LRvu74GBiimg4LQrnZi6?p=preview
We hope that you will enjoy this feature that makes Syncfusion maps more usable. If you have any questions or need any clarification, please let us know in the comments section. You can also contact us through our support forum or Direct-Trac. We are always happy to assist you!
If you like this blog post, we think you’ll also like the following free e-books:


