
This post is part of our ongoing how-to series about using the Syncfusion Dashboard Platform. In this post, we’ll review how to work with dashboard parameters. On our YouTube channel you’ll find a full video on this topic.
Dashboard parameters help you assign values to query parameters and dynamically change those values when you view the dashboard in the dashboard viewer and server. You can use dashboard parameters in calculated fields, and you can assign parameter values in user-based filters.
We’ll demonstrate this with the help of an example.
With the Dashboard Designer, we’re going to use a custom query to build a dashboard.
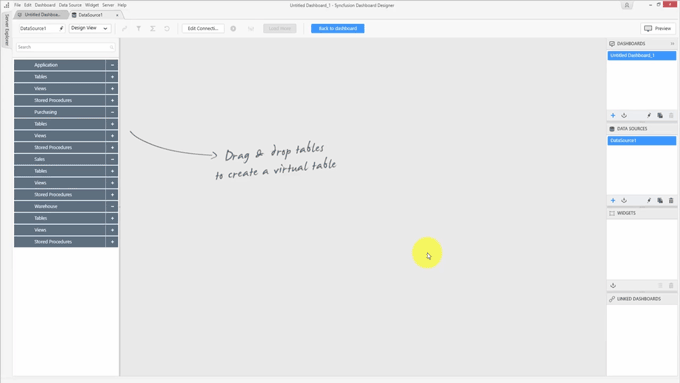
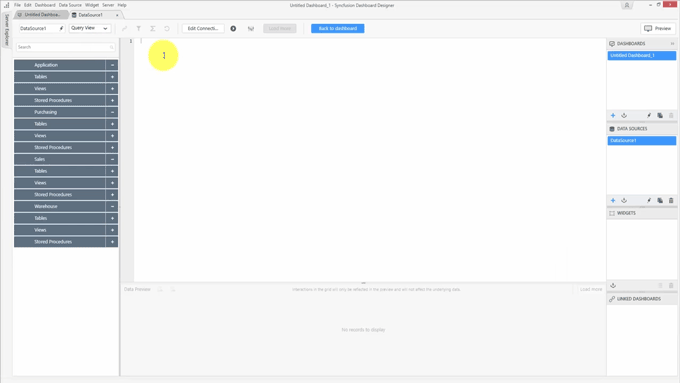
Change the design mode to Query View, and copy the custom query.
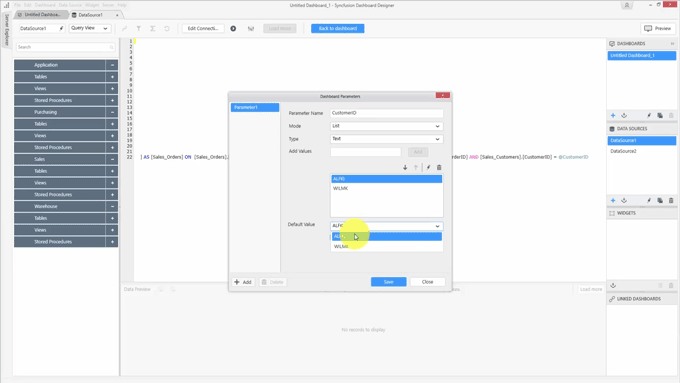
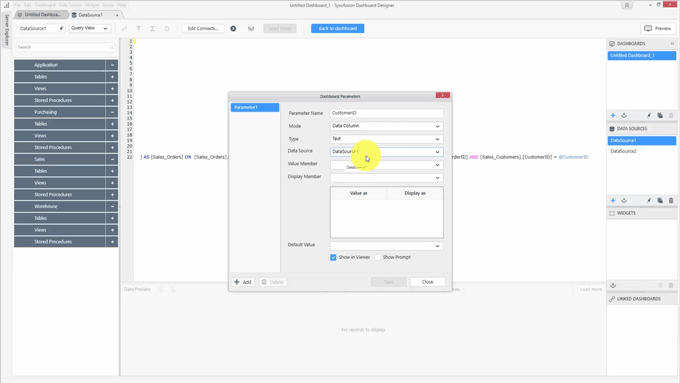
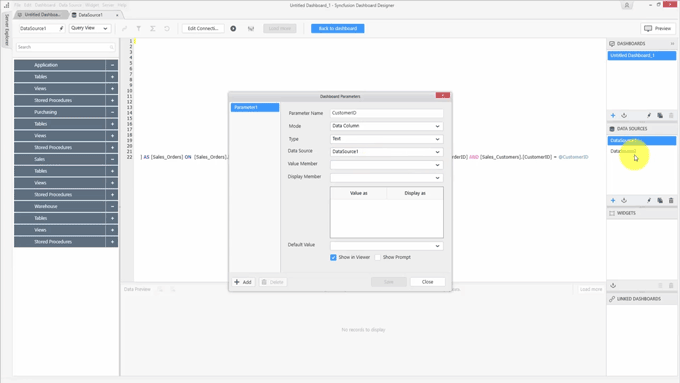
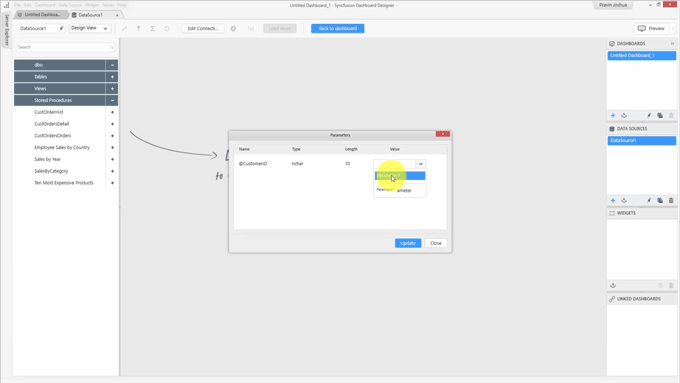
As you can see, the query is a parameterized query. Now you need to assign a value to the customer ID parameter. Open the dashboard parameter window. You can find it in the Dashboard menu or you can use the CTRL+SHIFT+D keyboard shortcut. Add a parameter by clicking the Add button, then provide a name for your parameter. The name should not contain special characters or white spaces. Provide the same parameter name that is available in the custom query.
There are three different modes available. The first is Literal mode, in which you provide a single value to the parameter. When the Show in Viewer option is enabled, you can modify the parameter value based upon your data type in the dashboard viewer or server through a text box, numeric up-down, or date-picker control.

The second one is the List mode. In this mode, you can enter a list of values manually via the Add Values field. You can also choose the default value from the Default Value field’s drop-down menu. When the Show in Viewer option is enabled in the dashboard viewer, you can modify the parameter by choosing an item from the list.
The third one is the Data Column mode. In this mode, you can copy a list of values from the same data source or a different one.
Remember, this is only a copy; any change to the original data source will not affect the copied values. In this example, the customer ID and customer names are available in another data source, as seen in the DATA SOURCES pane to the right.
Select Number from the Type field and select the data source from the Data Source field. There’s only one numeric column available in the second data source, so that will be filtered. You can also choose a different display number for your parameter.
When the Show in Viewer option is enabled in the dashboard viewer, you will see only the display number in the list.
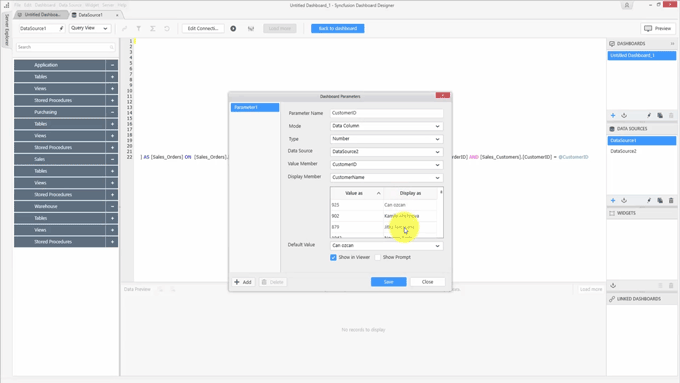
If you need to modify the parameter, you can choose one from the list. We’re going to use the customer ID, so select that item and a default value. If the Show in Viewer option is disabled, you will not be able to modify the parameter value in the dashboard viewer or server. The Show Prompt option displays a dialog when you open the dashboard in the dashboard viewer.
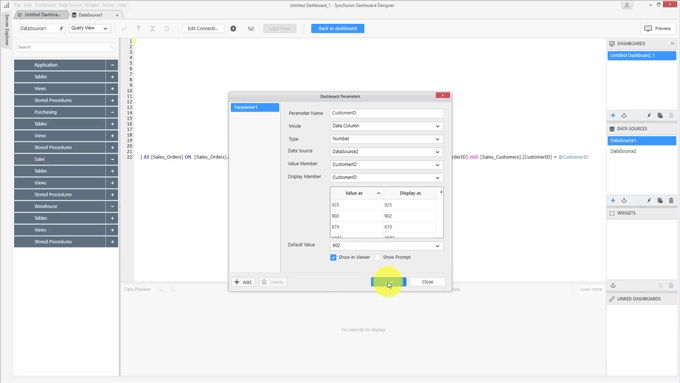
Only upon entering the value of the parameter will you be allowed to view the dashboard.
Click Save and then click Execute to execute the query.

The query will be executed based upon the default value you selected in the dashboard parameter window. As stated earlier, dashboard parameters can also be used in stored procedures. We’ll look at an example of this.
Using the Northwind database, you’ll find you already have a parameter containing the customer IDs in List mode.

Choose a default value and update the parameter, then drag and drop a stored procedure.
Now, you can choose the required parameter from a list. You can also create a new parameter if required.
Choose the parameter we already created and click Update. The query will be executed based upon the selected default value. Since the dashboard parameters are commonly available across the entire dashboard, you can use the same parameter in different data sources, and you can use the same parameter in calculated fields.
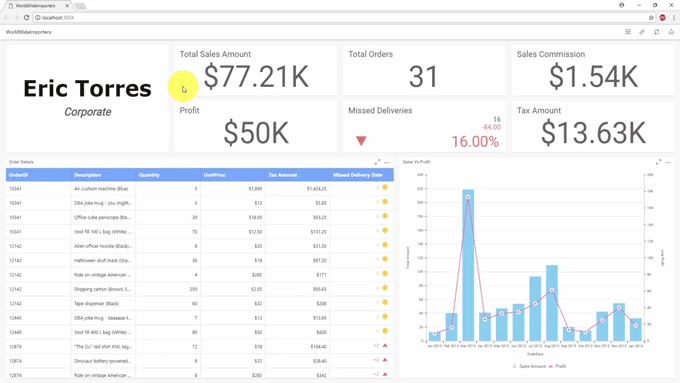
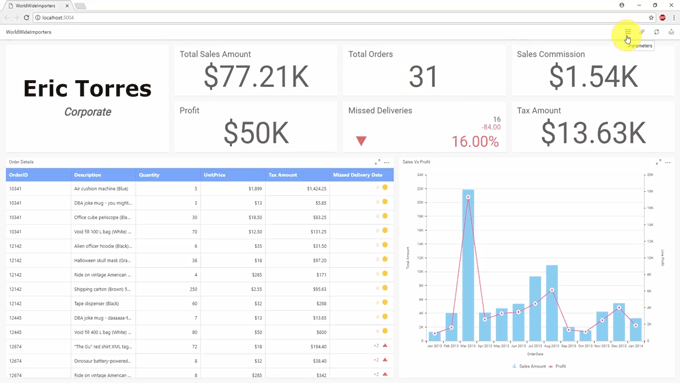
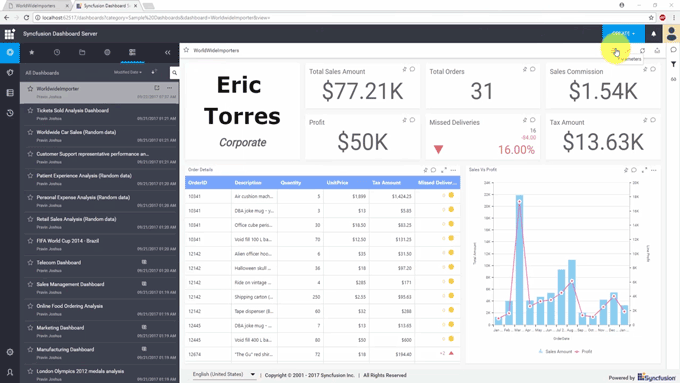
Return to the original data source. Now you should have the sales orders details. We’re going to build a dashboard based on the available data. The following image shows a dashboard with the sales details.

The dashboard now shows various details—such as sales amount, total orders, and many other things—based on the selected customer. We need to add one final thing to the dashboard, and that is sales commission. By adding this, you’ll see how to use parameters in calculated fields.
The sales commission we’re going to add is dynamically based on the current rate. Let’s add a parameter to calculate the sales commission.
- Open the Parameters window and add a parameter named CommissionRate.
- Choose the Literal mode, since we don’t have a list of predefined commission rates, and we know only the current value.
- Set the Type field to Number.
- Provide the current sales commission rate. Ensure that the Show in Viewer option is enabled so you can supply the current value in the viewer.
- Click Save.
Add a card widget to show the sales commission.
Now, let’s configure it.
We already have several expression columns. Among them is Total Sales Amount. By using this expression column, you can calculate the sales commission. Add another expression column and name it SalesCommission.
The sales commission is a percentage of the total amount. Right now, you have provided the commission rate as value of 2 in the parameter. So, we’re going to use that parameter.
In the formula for calculating the sales commission, provide the commission rate parameter so that you can change it dynamically whenever required in the dashboard viewer or server.
Once you click Save, you can then bind the expression column to the actual value of the card budget.
The dashboard is now complete. Click Preview to see how it is displayed in the dashboard viewer.
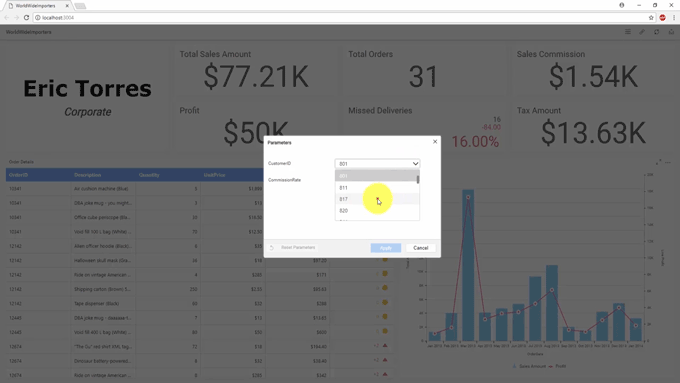
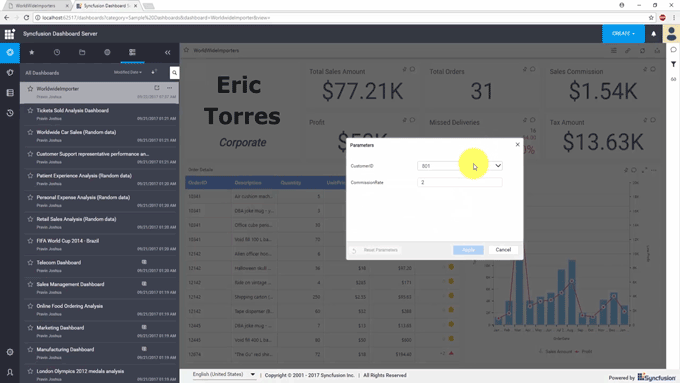
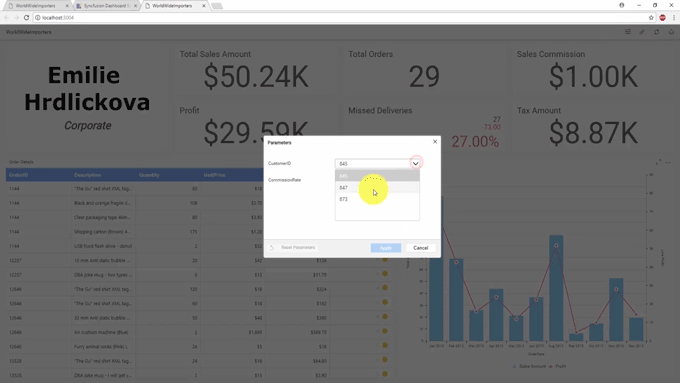
The dashboard should now render as expected. There is a Settings icon available at the top where you can see the parameters we added earlier.
You can change the parameters and display the details for different customers. You can also change the commission rate whenever needed and calculate the sales commission.
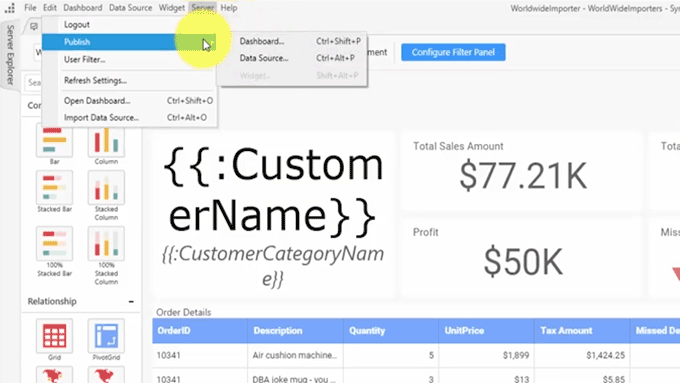
Now, let’s publish this dashboard to the dashboard server. Go to the Server menu and select Publish Dashboard.
The dashboard is now successfully published. Open the dashboard server to look at it. The dashboard is listed on the left side.
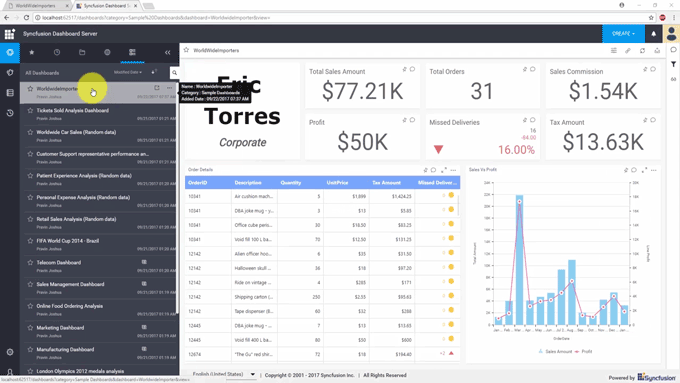
You can use the Parameters option and modify the parameters’ values whenever required.
You can use the dashboard parameters in user-based filters. You can assign specific parameter values to dashboard-server users and restrict the users from accessing other values.
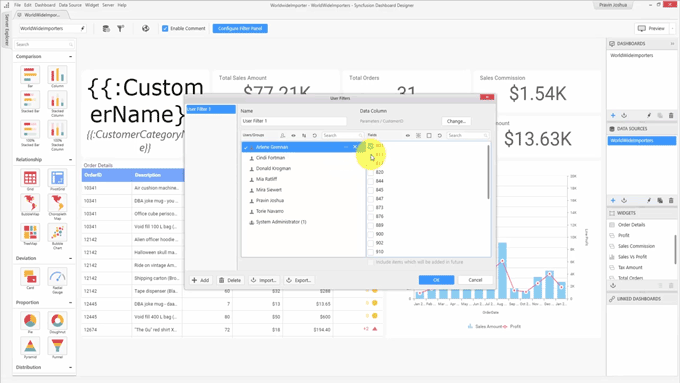
Go to the Server menu and choose User Filter.
Add a filter. You can see the list of available parameters. Only lists and data column types of parameters will be available for user-based filters. Choose one.
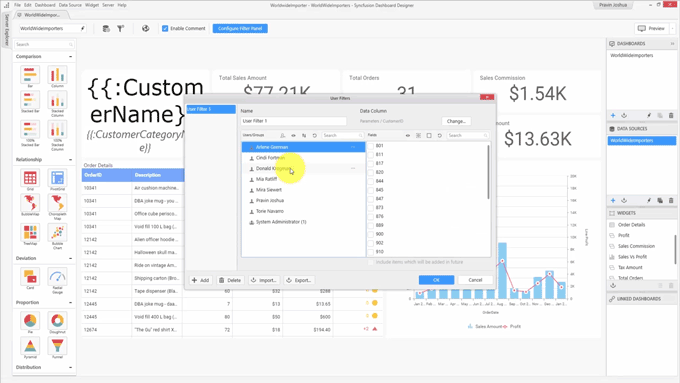
So, we have a list of dashboard server users on the left side and different parameter values at the right side. You can provide access to specific values for different users.
Click OK.
When you preview this dashboard as one of the users, you can see that for the parameter, only the availed values are present, and only the values from this list can be chosen.
If you want to prevent users from accessing and modifying parameter values, you can go to the parameter window and clear the Show in Viewer option. Since we have removed that option for both parameters, the parameter option will not display in the viewer. It also will not be available in the server.
For more information about the numerous Dashboard Platform features, see our documentation. If you have yet to use the Syncfusion Dashboard Platform, try it out with a free, 30-day trial.
If you liked this post, we think you’ll love these free e-books:
BI Solutions Using SSAS Tabular Model Succinctly
MongoDB 3 Succinctly
Hadoop Succinctly
Power BI Succinctly
R Programming Succinctly


Comments (1)
well done.
Comments are closed.